Ad Dir`iyah Airbnb Market Analysis 2026: Short Term Rental Data & Vacation Rental Statistics in Riyadh Region, Saudi Arabia
Is Airbnb profitable in Ad Dir`iyah in 2026? Explore comprehensive Airbnb analytics for Ad Dir`iyah, Riyadh Region, Saudi Arabia to uncover income potential. This 2026 STR market report for Ad Dir`iyah, based on AirROI data from February 2025 to January 2026, reveals key trends in the niche market of 100 active listings.
Whether you're considering an Airbnb investment in Ad Dir`iyah, optimizing your existing vacation rental, or exploring rental arbitrage opportunities, understanding the Ad Dir`iyah Airbnb data is crucial. Navigating the high regulation landscape is key to maximizing your short term rental income potential. Let's dive into the specifics.
Key Ad Dir`iyah Airbnb Performance Metrics Overview
Monthly Airbnb Revenue Variations & Income Potential in Ad Dir`iyah (2026)
Understanding the monthly revenue variations for Airbnb listings in Ad Dir`iyah is key to maximizing your short term rental income potential. Seasonality significantly impacts earnings. Our analysis, based on data from the past 12 months, shows that the peak revenue month for STRs in Ad Dir`iyah is typically February, while August often presents the lowest earnings, highlighting opportunities for strategic pricing adjustments during shoulder and low seasons. Explore the typical Airbnb income in Ad Dir`iyah across different performance tiers:
- Best-in-class properties (Top 10%) achieve $2,471+ monthly, often utilizing dynamic pricing and superior guest experiences.
- Strong performing properties (Top 25%) earn $1,488 or more, indicating effective management and desirable locations/amenities.
- Typical properties (Median) generate around $754 per month, representing the average market performance.
- Entry-level properties (Bottom 25%) see earnings around $353, often with potential for optimization.
Average Monthly Airbnb Earnings Trend in Ad Dir`iyah
Ad Dir`iyah Airbnb Occupancy Rate Trends (2026)
Maximize your bookings by understanding the Ad Dir`iyah STR occupancy trends. Seasonal demand shifts significantly influence how often properties are booked. Typically, Februarysees the highest demand (peak season occupancy), while August experiences the lowest (low season). Effective strategies, like adjusting minimum stays or offering promotions, can boost occupancy during slower periods. Here's how different property tiers perform in Ad Dir`iyah:
- Best-in-class properties (Top 10%) achieve 68%+ occupancy, indicating high desirability and potentially optimized availability.
- Strong performing properties (Top 25%) maintain 46% or higher occupancy, suggesting good market fit and guest satisfaction.
- Typical properties (Median) have an occupancy rate around 24%.
- Entry-level properties (Bottom 25%) average 12% occupancy, potentially facing higher vacancy.
Average Monthly Occupancy Rate Trend in Ad Dir`iyah
Average Daily Rate (ADR) Airbnb Trends in Ad Dir`iyah (2026)
Effective short term rental pricing strategy in Ad Dir`iyah involves understanding monthly ADR fluctuations. The Average Daily Rate (ADR) for Airbnb in Ad Dir`iyah typically peaks in February and dips lowest during September. Leveraging Airbnb dynamic pricing tools or strategies based on this seasonality can significantly boost revenue. Here's a look at the typical nightly rates achieved:
- Best-in-class properties (Top 10%) command rates of $239+ per night, often due to premium features or locations.
- Strong performing properties (Top 25%) achieve nightly rates of $113 or more.
- Typical properties (Median) charge around $82 per night.
- Entry-level properties (Bottom 25%) earn around $70 per night.
Average Daily Rate (ADR) Trend by Month in Ad Dir`iyah
Get Live Ad Dir`iyah Market Intelligence 👇
Explore Real-time Analytics
Airbnb Seasonality Analysis & Trends in Ad Dir`iyah (2026)
Peak Season (February, November, July)
- Revenue averages $1,393 per month
- Occupancy rates average 34.7%
- Daily rates average $122
Shoulder Season
- Revenue averages $1,133 per month
- Occupancy maintains around 30.6%
- Daily rates hold near $118
Low Season (January, August, December)
- Revenue drops to average $997 per month
- Occupancy decreases to average 28.6%
- Daily rates adjust to average $117
Seasonality Insights for Ad Dir`iyah
- The Airbnb seasonality in Ad Dir`iyah shows moderate seasonality with distinct peak and low periods. While the sections above show seasonal averages, it's also insightful to look at the extremes:
- During the high season, the absolute peak month showcases Ad Dir`iyah's highest earning potential, with monthly revenues capable of climbing to $1,556, occupancy reaching a high of 39.4%, and ADRs peaking at $127.
- Conversely, the slowest single month of the year, typically falling within the low season, marks the market's lowest point. In this month, revenue might dip to $966, occupancy could drop to 26.5%, and ADRs may adjust down to $111.
- Understanding both the seasonal averages and these monthly peaks and troughs in revenue, occupancy, and ADR is crucial for maximizing your Airbnb profit potential in Ad Dir`iyah.
Seasonal Strategies for Maximizing Profit
- Peak Season: Maximize revenue through premium pricing and potentially longer minimum stays. Ensure high availability.
- Low Season: Offer competitive pricing, special promotions (e.g., extended stay discounts), and flexible cancellation policies. Target off-season travelers like remote workers or budget-conscious guests.
- Shoulder Seasons: Implement dynamic pricing that balances peak and low rates. Target weekend travelers or specific events. Offer slightly more flexible terms than peak season.
- Regularly analyze your own performance against these Ad Dir`iyah seasonality benchmarks and adjust your pricing and availability strategy accordingly.
Best Areas for Airbnb Investment in Ad Dir`iyah (2026)
Exploring the top neighborhoods for short-term rentals in Ad Dir`iyah? This section highlights key areas, outlining why they are attractive for hosts and guests, along with notable local attractions. Consider these locations based on your target guest profile and investment strategy.
| Neighborhood / Area | Why Host Here? (Target Guests & Appeal) | Key Attractions & Landmarks |
|---|---|---|
| Al-Turaif District | The historic heart of Ad Dir'iyah, known for its mud-brick architecture and UNESCO World Heritage status. An ideal location for culturally inclined tourists seeking to explore Saudi history. | Al-Turaif District, Diriyah Museum, Salwa Palace, Historic Dens of Diriyah, At-Turaif Historical District |
| Diriyah Gate | A new development project aimed at creating a vibrant tourist destination that highlights Saudi culture and hospitality. Perfect for those looking to stay in a modern yet culturally rich area. | Diriyah Gate, Cafes and Restaurants, Cultural Events, Art Galleries, Shopping Areas |
| Al-Aqiq | A quiet residential area with a blend of modern and traditional vibes. This location is suitable for families and those wanting a serene stay while still being close to attractions. | Al-Aqiq Park, Shopping Malls, Local Dining, Community Events, Cultural Insights |
| Al-Masif | Popular among local residents and a growing favorite for visitors seeking a local atmosphere. Offers a mix of modern amenities and cultural connections. | Al-Masif Mall, Local Markets, Recreational Parks, Dining Options, Community Centers |
| Safa Park | A peaceful park area that attracts nature lovers and families. It’s great for short-term stays where guests can enjoy serene walks and community life. | Safa Park, Family Play Areas, Outdoor Activities, Picnic Spots, Local Festivals |
| Namar | Another residential area that is gaining popularity with visitors, offering local markets and authentic Saudi experiences. | Namar Park, Local Cuisine, Shopping Centers, Traditional Souqs, Cultural Experiences |
| Palace District | Surrounding the grand historical palaces, this area is ideal for those wanting to immerse themselves in royal heritage and culture. | Al-Nasif Palace, Cultural Exhibitions, Heritage Tours, Historical Landmarks, Gardens and Green Spaces |
| Oasis Resort Area | A luxurious resort and relaxation area that attracts both domestic and international tourists looking for a getaway experience in a tranquil setting. | Luxury Resorts, Spa Facilities, Swimming Pools, Outdoor Activities, Nature Trails |
Understanding Airbnb License Requirements & STR Laws in Ad Dir`iyah (2026)
Yes, Ad Dir`iyah, Riyadh Region, Saudi Arabia enforces high STR regulations. Obtaining a license and ensuring compliance is almost certainly required according to current 2026 STR laws. Always verify the latest short term rental regulations and Airbnb license requirements directly with local government authorities for Ad Dir`iyah to ensure full compliance before hosting.
(Source: AirROI data, 2026, based on 83% licensed listings)
Top Performing Airbnb Properties in Ad Dir`iyah (2026)
Benchmark your potential! Explore examples of top-performing Airbnb properties in Ad Dir`iyahbased on Trailing Twelve Month (TTM) revenue. Analyze their characteristics, revenue, occupancy rate, and ADR to understand what drives success in this market.

Garden View with Swimming Pool
Entire Place • 3 bedrooms

FA1. Garden Residence | Hittin
Entire Place • 3 bedrooms

GR - Elegant 3-BD Apartment| Prime Riyadh Location
Entire Place • 3 bedrooms

Ouja | Modern 1BR, 85" TV, Huge Living, Self-Entry
Entire Place • 1 bedroom
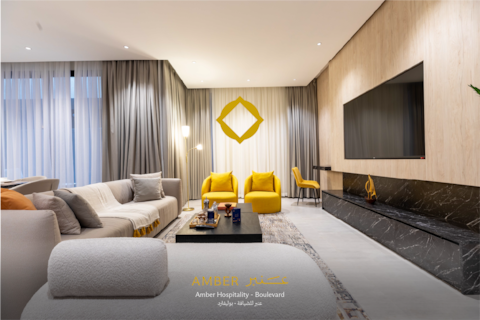
Amber Hospitality - BLVD - 3BR Deluxe
Entire Place • 3 bedrooms
Kameil Laxiours 3Bd | 180 m2 | 5 m BLVD
Entire Place • 3 bedrooms
Note: Performance varies based on location, size, amenities, seasonality, and management quality. Data reflects the past 12 months.
Top Performing Airbnb Hosts in Ad Dir`iyah (2026)
Learn from the best! This table showcases top-performing Airbnb hosts in Ad Dir`iyah based on the number of properties managed and estimated total revenue over the past year. Analyze their scale and performance metrics.
| Host Name | Properties | Grossing Revenue | Stay Reviews | Avg Rating |
|---|---|---|---|---|
| Hana | 3 | $66,951 | 164 | 4.84/5.0 |
| Faisal | 3 | $49,600 | 285 | 4.86/5.0 |
| Abdulah | 1 | $47,417 | 49 | 5.00/5.0 |
| Saleh | 1 | $45,469 | 24 | 5.00/5.0 |
| Mabaat | 3 | $45,251 | 54 | 4.55/5.0 |
| Hesham | 2 | $35,770 | 48 | 4.93/5.0 |
| Guestready | 1 | $26,641 | 24 | 4.75/5.0 |
| Amber Hospitality - BLVD | 1 | $24,521 | 29 | 4.90/5.0 |
| عبدالاله | 9 | $22,938 | 113 | 4.44/5.0 |
| Abdullah | 1 | $22,357 | 129 | 4.91/5.0 |
Analyzing the strategies of top hosts, such as their property selection, pricing, and guest communication, can offer valuable lessons for optimizing your own Airbnb operations in Ad Dir`iyah.
Dive Deeper: Advanced Ad Dir`iyah STR Market Data (2026)
Ready to unlock more insights? AirROI provides access to advanced metrics and comprehensive Airbnb data for Ad Dir`iyah. Explore detailed analytics beyond this report to refine your investment strategy, optimize pricing, and maximize your vacation rental profits.
Explore Advanced MetricsAd Dir`iyah Short-Term Rental Market Composition (2026): Property & Room Types
Room Type Distribution
Property Type Distribution
Market Composition Insights for Ad Dir`iyah
- The Ad Dir`iyah Airbnb market composition is heavily skewed towards Entire Home/Apt listings, which make up 97% of the 100 active rentals. This indicates strong guest preference for privacy and space.
- Looking at the property type distribution in Ad Dir`iyah, Apartment/Condo properties are the most common (100%), reflecting the local real estate landscape.
Ad Dir`iyah Airbnb Room Capacity Analysis (2026): Bedroom Distribution
Distribution of Listings by Number of Bedrooms
Room Capacity Insights for Ad Dir`iyah
- The dominant room capacity in Ad Dir`iyah is 1 bedroom listings, making up 79% of the market. This suggests a strong demand for properties suitable for couples or solo travelers.
- Together, 1 bedroom and 3 bedrooms properties represent 93.0% of the active Airbnb listings in Ad Dir`iyah, indicating a high concentration in these sizes.
- With over half the market (79%) consisting of studios or 1-bedroom units, Ad Dir`iyah is particularly well-suited for individuals or couples.
Ad Dir`iyah Vacation Rental Guest Capacity Trends (2026)
Distribution of Listings by Guest Capacity
Guest Capacity Insights for Ad Dir`iyah
- The most common guest capacity trend in Ad Dir`iyah vacation rentals is listings accommodating 4 guests (32%). This suggests the primary traveler segment is likely small families or groups.
- Properties designed for 4 guests and 2 guests dominate the Ad Dir`iyah STR market, accounting for 61.0% of listings.
- 11.0% of properties accommodate 6+ guests, serving the market segment for larger families or group travel in Ad Dir`iyah.
- On average, properties in Ad Dir`iyah are equipped to host 3.5 guests.
Ad Dir`iyah Airbnb Booking Patterns (2026): Available vs. Booked Days
Available Days Distribution
Booked Days Distribution
Booking Pattern Insights for Ad Dir`iyah
- The most common availability pattern in Ad Dir`iyah falls within the 271-366 days range, representing 77% of listings. This suggests many properties have significant open periods on their calendars.
- Approximately 97.0% of listings show high availability (181+ days open annually), indicating potential for increased bookings or specific owner usage patterns.
- For booked days, the 1-30 days range is most frequent in Ad Dir`iyah (43%), reflecting common guest stay durations or potential owner blocking patterns.
- A notable 3.0% of properties secure long booking periods (181+ days booked per year), highlighting successful long-term rental strategies or significant owner usage.
Ad Dir`iyah Airbnb Minimum Stay Requirements Analysis
Distribution of Listings by Minimum Night Requirement
1 Night
85 listings
85% of total
2 Nights
3 listings
3% of total
4-6 Nights
2 listings
2% of total
7-29 Nights
2 listings
2% of total
30+ Nights
8 listings
8% of total
Key Insights
- The most prevalent minimum stay requirement in Ad Dir`iyah is 1 Night, adopted by 85% of listings. This highlights the market's preference for shorter, flexible bookings.
- A strong majority (88.0%) of the Ad Dir`iyah Airbnb data shows acceptance of very short stays (1-2 nights), indicating a dynamic, high-turnover market.
Recommendations
- Align with the market by considering a 1 Night minimum stay, as 85% of Ad Dir`iyah hosts use this setting.
- Explore offering discounts for stays of 30+ nights to attract the 8% of the market seeking extended stays.
- Adjust minimum nights based on seasonality – potentially shorter during low season and longer during peak demand periods in Ad Dir`iyah.
Ad Dir`iyah Airbnb Cancellation Policy Trends Analysis (2026)
Limited
2 listings
2% of total
Flexible
70 listings
70% of total
Moderate
18 listings
18% of total
Firm
5 listings
5% of total
Strict
5 listings
5% of total
Cancellation Policy Insights for Ad Dir`iyah
- The prevailing Airbnb cancellation policy trend in Ad Dir`iyah is Flexible, used by 70% of listings.
- The market strongly favors guest-friendly terms, with 88.0% of listings offering Flexible or Moderate policies. This suggests guests in Ad Dir`iyah may expect booking flexibility.
- Strict cancellation policies are quite rare (5%), potentially making listings with this policy less competitive unless justified by high demand or property type.
Recommendations for Hosts
- Consider adopting a Flexible policy to align with the 70% market standard in Ad Dir`iyah.
- Given the high prevalence of Flexible policies (70%), offering this can enhance booking appeal, especially during shoulder seasons.
- Using a Strict policy might deter some guests, as only 5% of listings use it. Evaluate if potential revenue protection outweighs possible lower booking rates.
- Regularly review your cancellation policy against competitors and market demand shifts in Ad Dir`iyah.
Ad Dir`iyah STR Booking Lead Time Analysis (2026)
Average Booking Lead Time by Month
Booking Lead Time Insights for Ad Dir`iyah
- The overall average booking lead time for vacation rentals in Ad Dir`iyah is 8 days.
- Guests book furthest in advance for stays during March (average 12 days), likely coinciding with peak travel demand or local events.
- The shortest booking windows occur for stays in July (average 2 days), indicating more last-minute travel plans during this time.
- Seasonally, Spring (10 days avg.) sees the longest lead times, while Summer (3 days avg.) has the shortest, reflecting typical travel planning cycles.
Recommendations for Hosts
- Use the overall average lead time (8 days) as a baseline for your pricing and availability strategy in Ad Dir`iyah.
- Target marketing efforts for the Spring season well in advance (at least 10 days) to capture early planners.
- Monitor your own booking lead times against these Ad Dir`iyah averages to identify opportunities for dynamic pricing adjustments.
Popular & Essential Airbnb Amenities in Ad Dir`iyah (2026)
Amenity Prevalence
Amenity Insights for Ad Dir`iyah
- Essential amenities in Ad Dir`iyah that guests expect include: Air conditioning, TV. Lacking these (any) could significantly impact bookings.
- Popular amenities like Wifi, Free parking on premises, Kitchen are common but not universal. Offering these can provide a competitive edge.
- Warning: Wifi is not universally provided but is considered essential globally. Ensure reliable Wifi is offered.
Recommendations for Hosts
- Ensure your listing includes all essential amenities for Ad Dir`iyah: Air conditioning, TV.
- Consider adding popular differentiators like Wifi or Free parking on premises to increase appeal.
- Highlight unique or less common amenities you offer (e.g., hot tub, dedicated workspace, EV charger) in your listing description and photos.
- Regularly check competitor amenities in Ad Dir`iyah to stay competitive.
Ad Dir`iyah Airbnb Guest Demographics & Profile Analysis (2026)
Guest Profile Summary for Ad Dir`iyah
- The typical guest profile for Airbnb in Ad Dir`iyah consists of primarily domestic travelers (74%), often arriving from nearby Riyadh, typically belonging to the Post-2000s (Gen Z/Alpha) group (50%), primarily speaking Arabic or English.
- Domestic travelers account for 73.7% of guests.
- Key international markets include Saudi Arabia (73.7%) and United States (5.8%).
- Top languages spoken are Arabic (49.6%) followed by English (42.2%).
- A significant demographic segment is the Post-2000s (Gen Z/Alpha) group, representing 50% of guests.
Recommendations for Hosts
- Target domestic marketing efforts towards travelers from Riyadh and Jeddah.
- Tailor amenities and listing descriptions to appeal to the dominant Post-2000s (Gen Z/Alpha) demographic (e.g., highlight fast WiFi, smart home features, local guides).
- Highlight unique local experiences or amenities relevant to the primary guest profile.
- Consider seasonal promotions aligned with peak travel times for key origin markets.
Nearby Short-Term Rental Market Comparison
How does the Ad Dir`iyah Airbnb market stack up against its neighbors? Compare key performance metrics like average monthly revenue, ADR, and occupancy rates in surrounding areas to understand the broader regional STR landscape.
| Market | Active Properties | Monthly Revenue | Daily Rate | Avg. Occupancy |
|---|---|---|---|---|
| Shmeisi Municipality | 11 | $718 | $181.29 | 34% |
| Al Maathar Municipality | 202 | $713 | $130.23 | 31% |
| Municipality of Al Shamal | 2,707 | $687 | $134.68 | 28% |
| Municipality of Olaya | 420 | $638 | $118.26 | 29% |
| الرياض | 58 | $634 | $141.11 | 27% |
| Al Naseem Municipality | 22 | $574 | $93.98 | 47% |
| As Sali Municipality | 19 | $570 | $97.26 | 31% |
| Riyadh | 3,466 | $552 | $114.00 | 29% |
| Municipalty of Irqah | 109 | $514 | $124.62 | 26% |
| Namar Municipality | 33 | $504 | $105.55 | 27% |